
golfastr provides tidy professional golf data in R: tournament schedules, leaderboards, hole-by-hole scoring, and strokes gained. Completed PGA Tour seasons are served from pre-built files hosted on GitHub releases (updated daily), so loading a full season takes seconds. Everything else falls back to the live ESPN API.
The season schedule
sched <- load_schedule(2025)
head(sched)
#> # A tibble: 6 × 4
#>   event_id  tournament_name          start_date end_date
#>   <chr>     <chr>                    <date>     <date>
#> 1 401703489 The Sentry               2025-01-02 2025-01-05
#> 2 401703490 Sony Open in Hawaii      2025-01-09 2025-01-12
#> 3 401703491 The American Express     2025-01-16 2025-01-19
#> 4 401703492 Farmers Insurance Open   2025-01-22 2025-01-25
#> 5 401703493 AT&T Pebble Beach Pro-Am 2025-01-30 2025-02-02
#> 6 401703494 WM Phoenix Open          2025-02-06 2025-02-09
Leaderboards
load_leaderboard() takes a year and an optional
tournament, matched by event ID or partial name:
masters <- load_leaderboard(2025, "Masters")
head(masters)
#> # A tibble: 6 × 8
#>   position player_id player_name       total_score score_to_par tournament_id
#>      <int> <chr>     <chr>                   <int> <chr>        <chr>
#> 1        1 3470      Rory McIlroy              277 -11          401703504
#> 2        2 569       Justin Rose               277 -11          401703504
#> 3        3 5579      Patrick Reed              279 -9           401703504
#> 4        4 9478      Scottie Scheffler         280 -8           401703504
#> 5        5 11382     Sungjae Im                281 -7           401703504
#> 6        6 10046     Bryson DeChambeau         281 -7           401703504
#> # ℹ 2 more variables: tournament_name <chr>, year <int>
Leave the tournament out to get every completed event in the season in one tibble:
season <- load_leaderboard(2025)
nrow(season)
#> [1] 5832
Hole-by-hole scoring
Hosted seasons include full-field scorecards, one row per player per hole:
holes <- load_holes(2025, "Masters")
head(holes)
#> # A tibble: 6 × 15
#>   player_id player_name position tournament_id tournament_name round  hole   par
#>   <chr>     <chr>          <int> <chr>         <chr>           <int> <int> <int>
#> 1 10046     Bryson DeC…        6 401703504     Masters Tourna…     1     1     4
#> 2 10046     Bryson DeC…        6 401703504     Masters Tourna…     1     2     5
#> 3 10046     Bryson DeC…        6 401703504     Masters Tourna…     1     3     4
#> 4 10046     Bryson DeC…        6 401703504     Masters Tourna…     1     4     3
#> 5 10046     Bryson DeC…        6 401703504     Masters Tourna…     1     5     4
#> 6 10046     Bryson DeC…        6 401703504     Masters Tourna…     1     6     3
#> # ℹ 7 more variables: score <int>, score_type <chr>, year <int>,
#> #   field_avg <dbl>, to_par <int>, vs_field <dbl>, cume_to_par <int>
That granularity is enough to rebuild the tournament story. For example, the cumulative score to par of the top five finishers:
library(ggplot2)

top5 <- masters |>
  slice_head(n = 5) |>
  pull(player_id)

race <- holes |>
  filter(player_id %in% top5) |>
  arrange(player_id, round, hole) |>
  group_by(player_id, player_name) |>
  mutate(
    hole_index = row_number(),
    to_par = cumsum(score - par)
  ) |>
  ungroup()

ggplot(race, aes(hole_index, to_par, color = player_name)) +
  geom_hline(yintercept = 0, linetype = "dashed", color = "grey60") +
  geom_step(linewidth = 0.8) +
  scale_y_reverse() +
  labs(
    title = "2025 Masters, top five finishers",
    x = "Holes played", y = "Score to par", color = NULL
  ) +
  theme_minimal()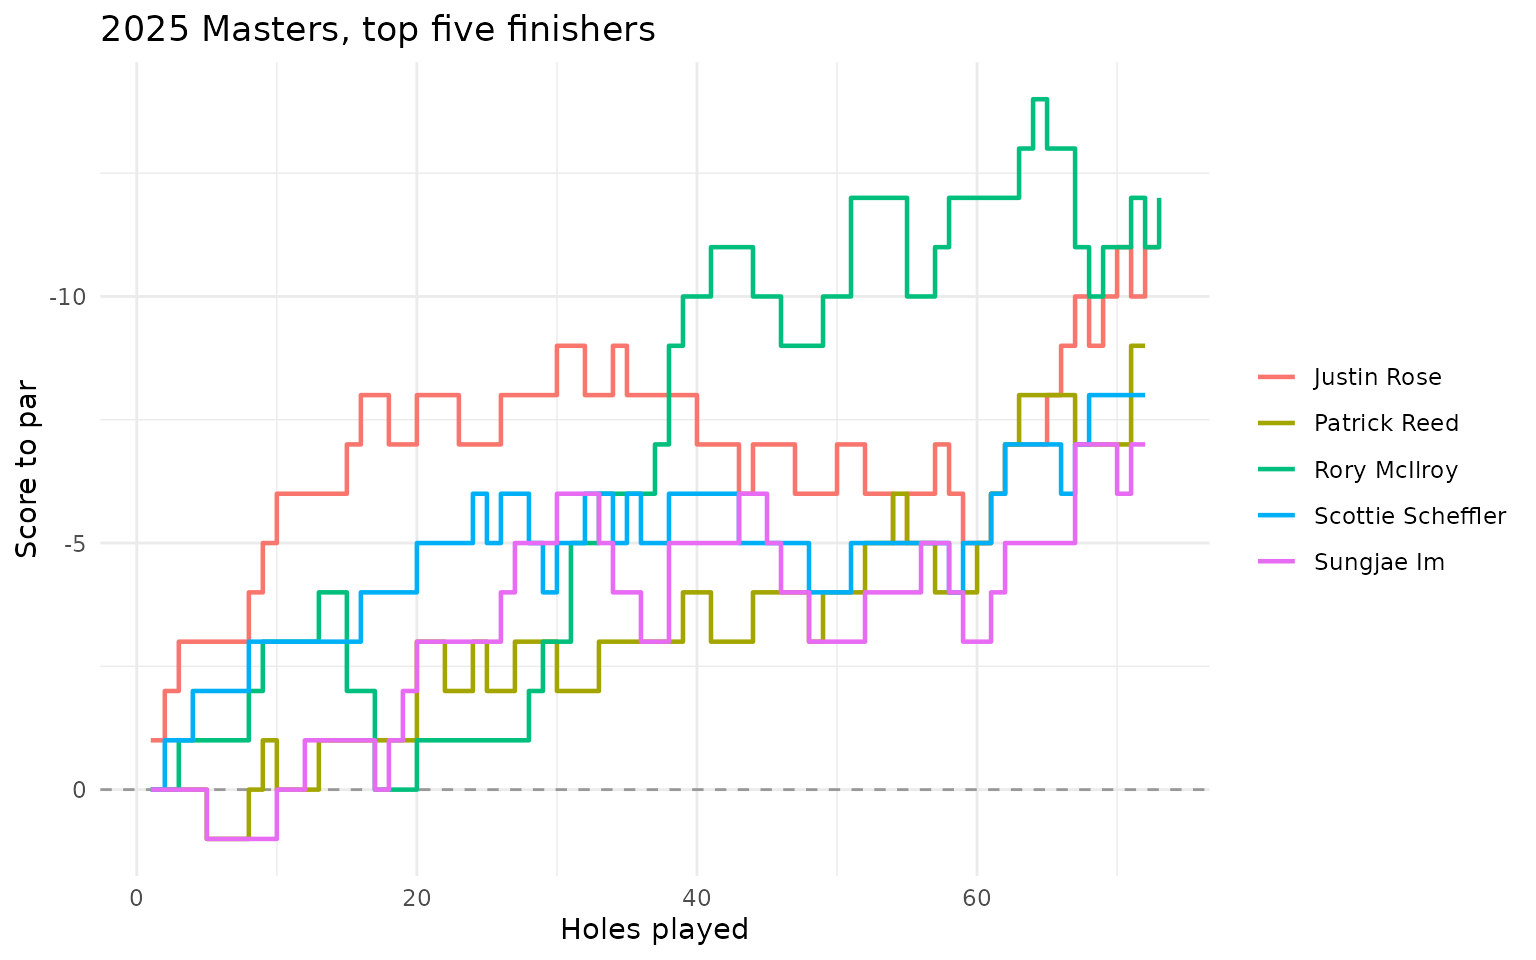
Strokes gained
Per-round strokes gained averages for the current season ship with the package:
load_strokes_gained("Scheffler")
#> # A tibble: 7 × 11
#>   player_id player_name     country sg_putt sg_arg sg_app sg_ott sg_t2g sg_total
#>   <chr>     <chr>           <chr>     <dbl>  <dbl>  <dbl>  <dbl>  <dbl>    <dbl>
#> 1 46046     Scottie Scheff… USA      -0.053  0.115  0.398  0.618  1.13     1.08
#> 2 46046     Scottie Scheff… USA       0.023  0.249  0.145  0.515  0.909    0.932
#> 3 46046     Scottie Scheff… USA       0.202  0.3    0.819  0.356  1.48     1.68
#> 4 46046     Scottie Scheff… USA      -0.301  0.399  1.19   1.02   2.62     2.31
#> 5 46046     Scottie Scheff… USA       0.095  0.316  1.27   0.816  2.40     2.50
#> 6 46046     Scottie Scheff… USA       0.382  0.322  1.29   0.748  2.36     2.74
#> 7 46046     Scottie Scheff… USA       0.68   0.379  0.653  0.661  1.69     2.37
#> # ℹ 2 more variables: rounds <int>, season <int>
Live data and other tours
Hosted data covers completed PGA Tour events. For tournaments in
progress, pass live = TRUE to query ESPN directly:
load_leaderboard(2026, "Travelers", live = TRUE)LIV Golf, the LPGA, the DP World Tour, and the Champions Tour are
available through the same functions via the tour
argument:
load_schedule(2026, tour = "lpga")
load_leaderboard(2026, "Adelaide", tour = "liv")
Field-level documentation for every column lives in the Field
descriptions article and in
pga_field_descriptions().